How to Pace the John F. Kennedy 50 Mile Ultramarathon
- Greg Marshall

- Nov 17, 2025
- 7 min read
Updated: Nov 24, 2025
Analysis of previous JFK 50 Mile race results reveals a common pattern to pacing a successful race

America's Oldest Ultramarathon will host its 63rd running this coming weekend. The race is unique from many ultramarathons in a few ways. For one, it is a largely flat, road-running style event. Nonetheless, the first ~16 miles run along the rolling hills of the Appalachian Trail, providing a bit of a more typical trail running component. This section is know to deliver fully on the trail experience with technical rocky patches and slippery autumn leaves to hide them.
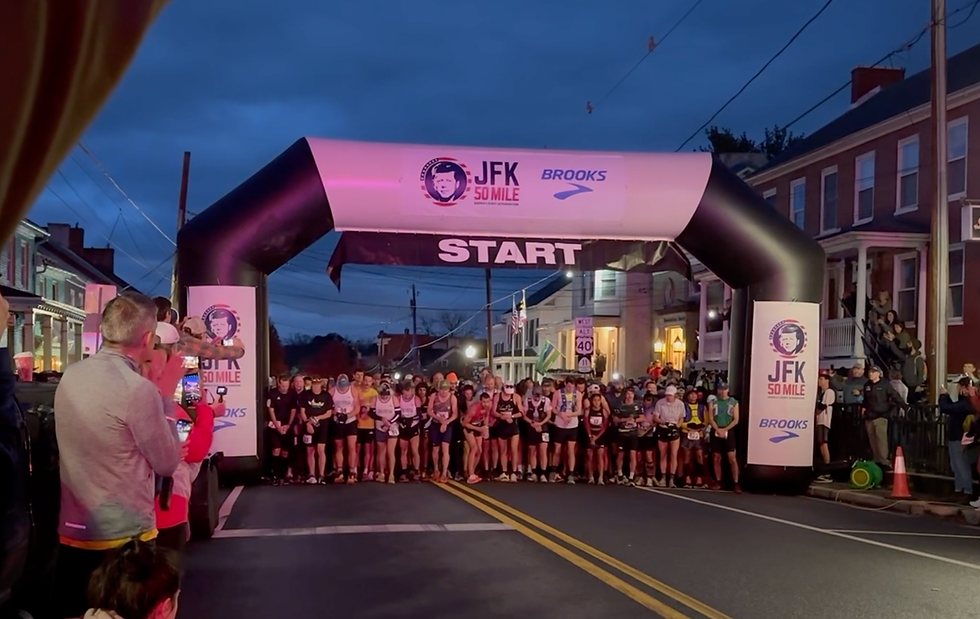
The race also boasts a large field of participants each year at ~1,200 that will stand at the starting line in Boonsboro, MD. It stands out in a sport that is used to low caps on the number of participants due to permitting and logistics. In 2023, Treeline Endurance was onsite for the John F. Kennedy 50 Mile in support of Shae Rhinehart as she completed her first 50 mile ultramarathon.
This coming weekend, Treeline Endurance will have 3 names on the starting list, including Robbe Reddinger of Believe in the Run.
"I've had an up-and-down training season with some ill-timed freak injuries, but I feel confident Coach Greg has put me in a place to succeed as I head into the race on Saturday," Reddinger said.
JFK 50 is known to be tricky in how to pace with the trail/road running hybrid. It's been said that "You can't win JFK on the trail portion, but you can lose it there." Furthermore, many athletes report having expended too much energy on the trail portion, and paying consequences in their overall experience and performance before they reached the finish line.
Therefore, the question we set out to answer: is there a common successful pacing strategy for the JFK 50 Mile?
Methods
We acquired the full detailed race results for the 2024 JFK 50 Mile from RunSignup.com. These results include the finish position, finish time, and several key waypoint split times along the race's 51-mile route. These key waypoints represent the crew access points, where runners may meet friends and family. They occur on course at the following locations:
Weverton Cliffs Aid (Mile 15.5; located at the end of the single track trail running portion of the race)
Antietam Aqueduct (Mile 27.1)
Taylor's Landing (Mile 38.4)
Dam 4 (Mile 41.8; no crew access here)
Finish Line (Mile 51)
Using these results, further analysis was conducted in Microsoft Excel. We determined:
Relative pace changes compared to each runner's overall average pace (expressed as a percentage)
Average pace for each runner for each segment between key waypoints (e.g. average pace from Weverton Cliffs to Antietam Aqueduct)
Each runner's relative segment pace, shown as a percentage of overall average pace for their race finish
Population analytics were then conducted to determine if commonalities in pacing strategy existed among race finishers
We also evaluated how top tier finishers (top 250) compared in pacing strategy to other groups (middle- and back-of-the-pack runners)
In order for a runner's results to be included in the analysis, they must have posted an official finish time (chip time was used), and to have registered their bib as they crossed through checkpoints on course (a short number of bibs did not scan at certain key waypoints on course).
Results
There were clear commonalities in pacing strategy present among 2024 JFK finishers. Unsurprisingly, the trail segment (Start to Weverton Cliffs) was the slowest portion of the race, on average. The fastest segment of the race was immediately following this section (Weverton Cliffs to Antietam Aqueduct). Runners then slowed from Antietam Aqueduct to Dam 4, before improving their pace again for the final 9.2 mile segment to the finish line.
Observations for Full Participant List

Participants ran the first 15.5 miles 9% slower than the pace they would ultimately realize as their overall average pace at the finish. For the 11.6 miles from Weverton Cliffs to Antietam Aqueduct, participants ran 10% faster than the overall pace they would achieve. From Antietam Aqueduct to Taylors Landing (11.3 miles), participants slowed down compared to in the previous segment of the race, and averaged a pace about 1% slower than their overall finish pace. From Taylors Landing to Dam 4 (3.4 miles), runners were 8% slower than their overall average pace, and for the final 9.2 miles, runners managed a pace 6% faster than their average, indicating a relatively strong finish.
It is worth noting that not all participants are likely to be trained the same way, and thus there will be some difference in the strengths and weaknesses among race participants. What follows provides clarity on this range of variation in pacing that might be used. We will revisit this in greater detail in the discussion.
Start to Weverton Cliffs (15.5 miles)
Participants within one standard deviation (the middle 68% of participants) ran this section between 1% and 17% slower than their average pace for the race (Figure 2).

Weverton Cliffs to Antietam Aqueduct (11.6 miles)
Participants within one standard deviation (the middle 68% of participants) ran this section between 5% and 15% faster than their average pace for the race (Figure 3).

Antietam Aqueduct to Taylors Landing (11.3 miles)
Participants within one standard deviation (the middle 68% of participants) ran this section between 4% faster and 6% slower than their average pace for the race (Figure 4).

Taylors Landing to Dam 4 (3.4 miles)
Participants within one standard deviation (the middle 68% of participants) ran this section between 2% faster and 18% slower than their average pace for the race (Figure 5).

Dam 4 to Finish (9.2 miles)
Participants within one standard deviation (the middle 68% of participants) ran this section between 13% faster and 1% slower than their average pace for the race (Figure 6).

Observations for Front, Middle, and Back-of-the-Pack Differences in Strategy
The histograms above were reproduced for select groups within the finishing ranks to identify any major differences that should be present in a pacing strategy if a participant expects to finish higher up or lower down in the ranks. We evaluated the Top 250 participant as a group (Top250), Places 250 to 500 (MiddlePack), and Places 575 to 825 (LatePack).
Across Top250, MiddlePack, and LatePack, the pacing trend remained the same as that shown in Figure 1 above. What distinguished Top 250 from MiddlePack and LatePack was the variation between runners (Figures 2 to 6 tend to be flatter with a less definitive peak in the middle).
Discussion
Is the most common pacing strategy really the best one?
Full Participant List Insights
Our results clearly indicate a common pathway to the finish line at the JFK 50. Run the trail section about 10% slower than your goal finish pace, then speed up when the trail ends.
Previous research in ultrarunning has shown that everyone slows down and ends the race at a slower average pace than they started with. This is likely due to the high degree of fatigue that is accumulated in very long events, which is hard to reproduce in training. What separated the elite from the average in that analysis was that the elites slow down less than the middle- and back-of-the-pack runners.
JFK 50 is a flat running event from Weverton Cliffs onward. The next hilliest part is actually the final 9 miles from Dam 4 to the finish line, with a cumulative elevation gain of about 300 feet.
The slowdown that occurs for most runners after Antietam Aqueduct is therefore a likely result of fatigue rather than related to deliberate slowing or terrain variation. Runners should set an easy and sustainable pace as they leave Weverton Cliffs, but they should expect that they will inevitably slow down over the final 20 miles due to the accumulation of fatigue while perceived effort remains the same of even increases.
Finisher Groups Insights
What is clear in examining differences between Top250, MiddlePack, and LatePack is that Top250 runners all pace in a very similar manner, and that is close to the average strategy indicated in Figure 1. This is likely the result of Top250 runners having higher awareness of the course demands as well as realistic expectations as to their performance abilities. This combination allows them to run their best races.
Looking at the three groups analyzed in this study, it is clear that the common pacing strategy indeed seems to be the best one, because those who follow that pacing strategy most closely will generally finish higher in the ranks.
Conclusion
The data suggests that all participants should pursue a pacing strategy similar to that shown in Figure 1. Some runners will be better at trail running while others are stronger on flatter surfaces. Some runners will be able to sustain their pace very well without slowing much over the final 50K, while others will run better by starting a bit faster out of Weverton Cliffs and letting themselves slow down a little more after Antietam Aqueduct.
Year-to-year performance will vary depending on various factors. If it is exceptionally hot, or there is snow on the trail, as has happened in the past, these will influence the pacing strategy of all runners in those less common conditions. The data here is from an average year at JFK 50, and depicts the way to succeed at this race in average conditions.
To conclude, we have provided two pacing table that follows the pacing strategy indicated by the data above. We believe that runners of all speeds can use these to effectively pace their race, allowing for better performance and more positive experiences in future years.
Join the movement and realize your potential.
Sign up below to join the Treeline Endurance community and receive updates on our latest posts. You can also follow us on Instagram and Facebook!

NOTE FOR TABLE 2 (below): The Fastest Recommended and Slowest Recommended Paces in Table 2 will not achieve the race time. Rather, they set bounds that keep runners within "striking distance" of the target time as described in the Results section above. If one segment is run at the Slowest Recommended Pace, it is assumed that you'll make up for this by running other portions at the Fastest Recommended Pace. For this reason, the Slowest Recommended Paces for 13:00:00 must be avoided for risk of missing cutoffs.


Comments